Diagnosing a CMW Platform Instance
1. Launch the Administration Tool (see Launching the CMW Lab Administration Tool).
2. Click the three bars button in the upper right corner of the Administration Tool.
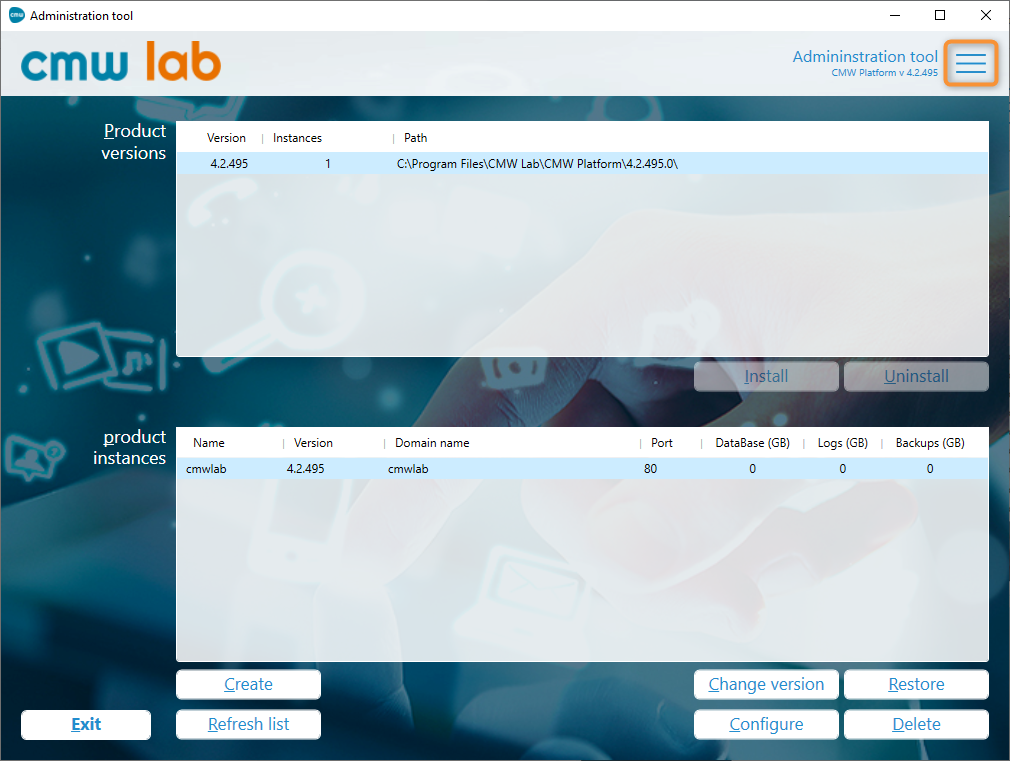
The Configuration button in the Administration Tool
3. The Administration tool configuration window appears.
5. Click the Diagnostics button.
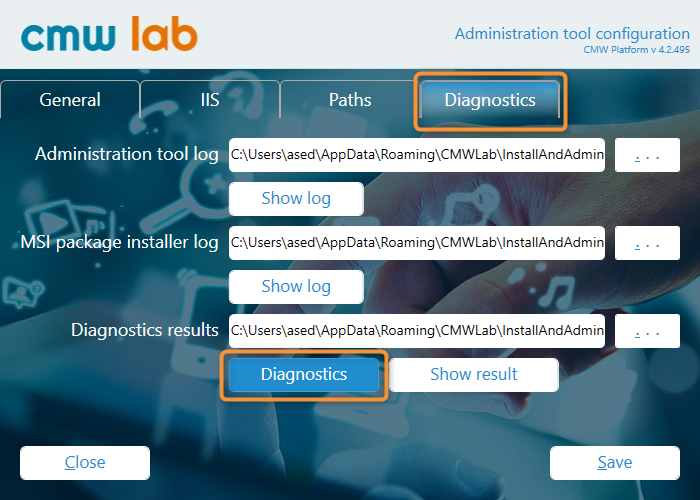
The Diagnostics tab in the Administration Tool configuration
5. The Product instance profiling window appears.
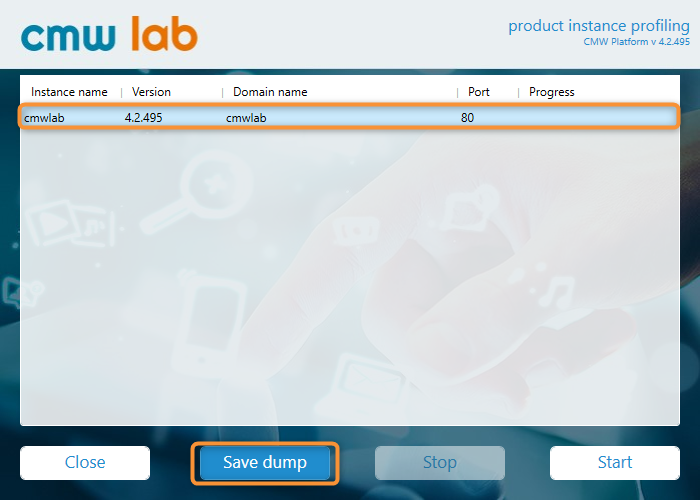
Collecting the memory dump for an instance
6. Select an instance that you want to diagnose.
7. To collect an instance memory dump, click Save dump.
7.1. A message appears indicating the start of the instance dump collection.
7.2. Click OK.
The memory dump collection start message
7.3. A window appears with the procdump.exe program running.
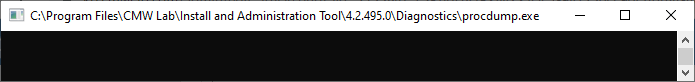
Procdump.exe program running
7.4. Wait for the procdump.exe program to close.
7.5. The procdump.exe program will save the instance memory dump to a .DMP file in the temp subfolder of the folder specified in the Diagnostics results field on the Diagnostics tab in the Administration Tool configuration window.
7.6. To view the dump, click Show result on the Diagnostics tab.
7.7. The Diagnostics folder opens (see the actual folder name may differ).
7.8. Open the temp subfolder.
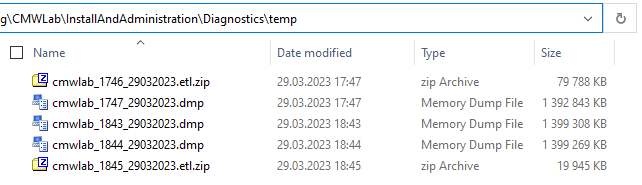
The location of the instance memory dump files
8. To collect an instance diagnostic data, select the instance and click Start in the Product instance profiling window.
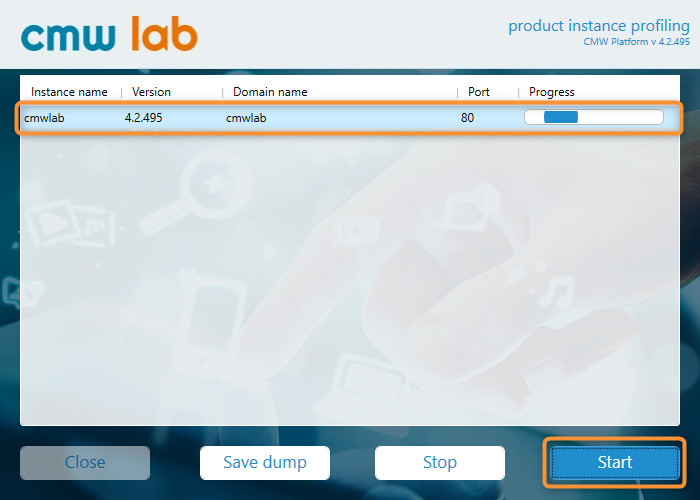
The instance diagnostics window
8.1. A message appears indicating the start of the instance diagnostics.
8.2. Click OK.
The diagnostics start message
8.3. The Progress column of the instances list shows the diagnostics progress bar.
8.4. The diagnostics will continue until you click Stop.
8.5. Click Stop.
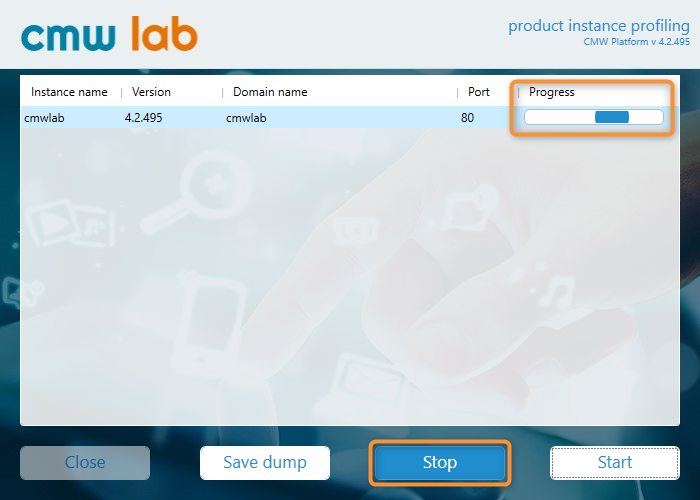
The diagnostics progress bar
8.6. A message appears indicating the start of the diagnostic data collection.
8.7. Click OK.
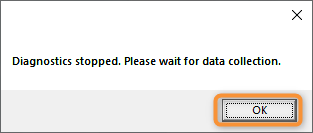
The diagnostic data collection start message
8.8. A window appears with the PerfVew.exe program running.
PerfVew.exe program running
8.9. Wait for the PerfVew.exe program to close.
8.10. The message appears indicating that the data collection is complete.
8.11. Click OK.
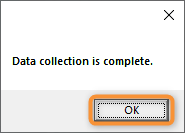
Diagnostic data collection completion message
8.12. The PerfVew.exe program will save the instance diagnostic data to a .ZIP archive in the folder specified in the Diagnostics results field on the Diagnostics tab of the Administration Tool configuration window.
8.13. To view the diagnostic files folder, click Show result on the Diagnostics tab.
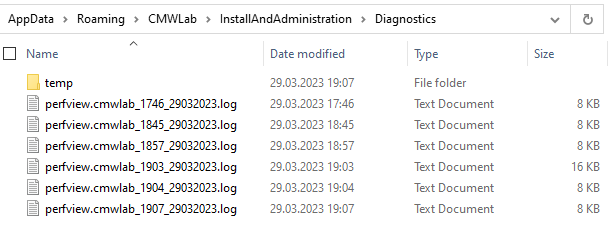
Diagnostic results folder example