History Events Chart
The History Events chart shows the work progress on tasks by a particular event, for example step changed, or item opened or closed.
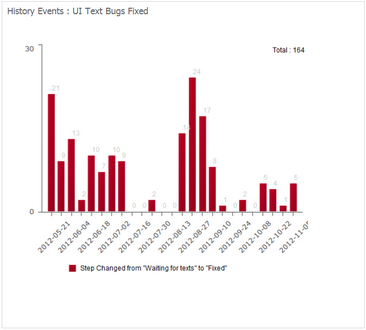
History Events widget
To create the History Events chart:
1. Select a dashboard in the Navigation pane.
2. Click the «Add Widget» button in the Ribbon.
3. Choose the «History Events Chart» widget type.
4. Select a list that will be used as the data source for your widget.
5. Complete the required fields as shown in the table below:
| Field | Description |
|---|---|
| Widget Name | Widget name will be displayed as a title for the widget in the dashboard. |
| Data Source | A list of tasks used as a data source for this widget. |
| Event |
Select between:
|
| Gorup By a Period of Time | A time period according to which the values of indicators in a chart will be grouped: by day, week, or month. |
6. When finished, click the «Finish» button. The widget will be added to your dashboard.