Adding and Configuring Widgets
Information about your tasks and documents is displayed on the dashboard through the use of widgets. You can add a widget to the dashboard and configure it to display the details you need. A widget can be added to the dashboard as many times as you need.
Each widget is tied to the selected list. All widgets have a number of display options such as data grouping, filtering and data presentation.
Available widgets
The following widget types can be added to a dashboard:
| Widget name | Description |
|---|---|
| Pie Chart | A pie chart displays value data as a percentage of a total. Consider using a pie chart after the data has been aggregated to seven data points or less (See also: Pie Chart). |
| Column Chart | A column chart displays a series as a set of vertical bars grouped by category. Column charts are useful for illustrating comparisons between items (See also: Column Chart). |
| Created vs. Closed | A chart showing the tasks or items created vs. closed over a given period of time (See also: Created vs. Closed Chart). |
| Bar Chart | A bar chart displays data horizontally. It is popular for categorical information, because the categories can be displayed horizontally (See also: Bar Chart). |
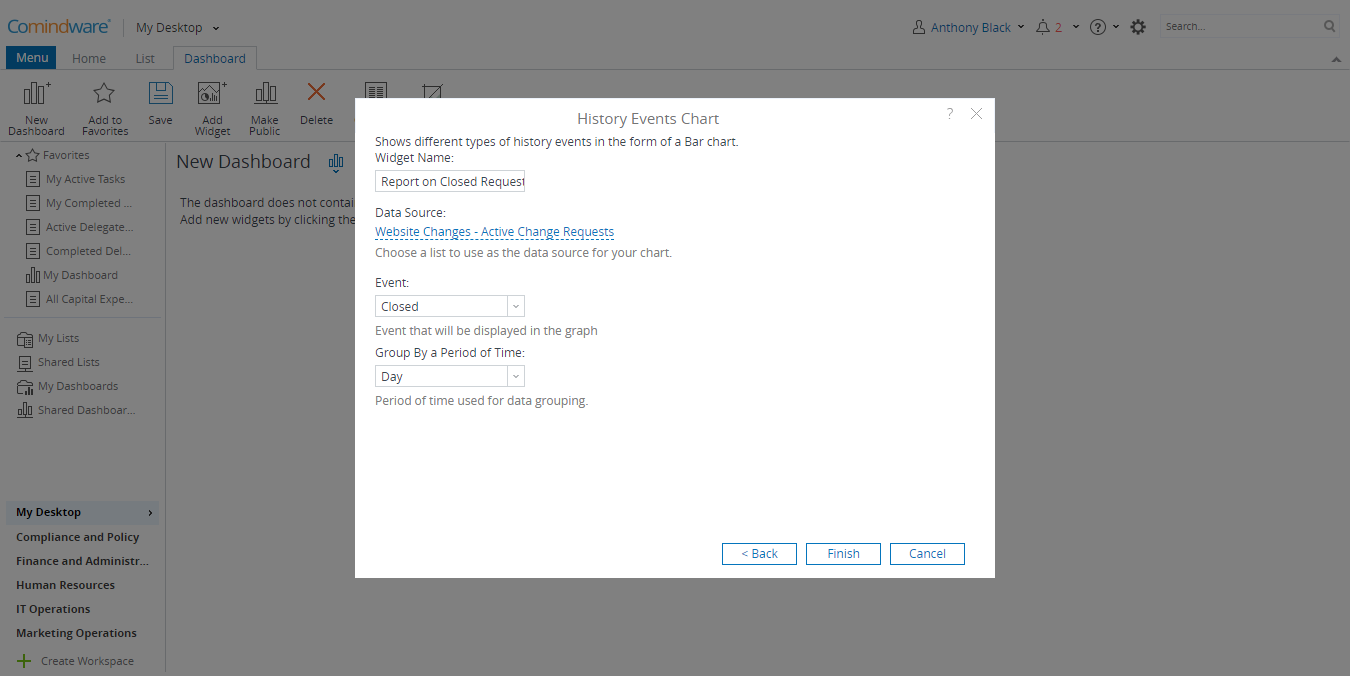
| History Events Chart | Shows the different types of history events in the form of a Column chart (See also: History Events Chart). |
Adding a widget in a dashboard
You can add any type of a widget in the dashboard.
To add a widget:
1. In the Navigation pane of the «My Desktop» area, select a dashboard where you want to add a widget.
2. Click the «Add Widget» button in the Ribbon.
3. Select the widget type.
4. Select the list which will be used as a source for widget data.
5. Configure other widget settings.
6. Click «Finish». Your widget will be added to the dashboard.

Configuring a widget
